We all see the ads on Facebook, Youtube, or Instagram that promise “zero electric bills with solar,” or that homeowners can “eliminate their electric bills.” You’re probably wondering–is this too good to be true? Although it’s technically possible to design a solar electric system to reduce your bill to virtually zero, it’s a bad idea. Read along to learn why.

Solar is a great investment. But many solar companies are either misinformed or deliberately obscure how solar savings actually works in Arizona. They confuse consumers and set up unreasonable expectations of what solar electric systems will do.

Net Zero Solar has been installing solar electric systems in southern Arizona for almost fifteen years, and several of our owners and employees have twenty-plus years of experience in renewable energy. We want to share the real deal on solar savings and solar sizing, so that you don’t get taken for an unexpected ride.
We’ll share how solar saves you money, explain some strategies for properly sizing your solar electric system, and explain some reasons you might want a system to produce more electricity than you currently use.
How Solar Saves You Money
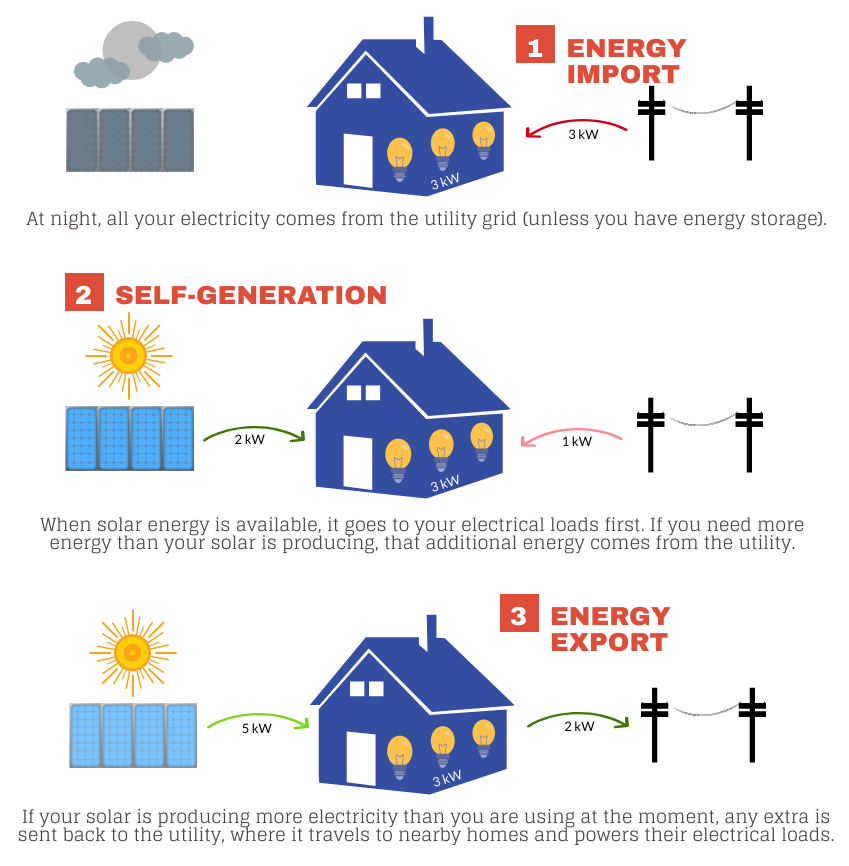
A home with a solar electric system operates in three different ways, depending on how much electricity you are using in the home, and how much the solar electric system is producing.
First, at night or during cloudy times, you’ll import electricity from the utility grid, and you’ll pay the retail rate for the electricity. For Tucson Electric Power, that retail rate averages about 15¢ per kilowatt-hour, or kWh.
When the solar electric system is generating electricity and you need that electricity in your home, you’ll use the energy from the solar immediately, and you’ll avoid buying expensive electricity from TEP. This is called “Self-Generation.” Depending on how many electrical loads you have on in your house, you may also import some energy from the grid at the same time.
Last, if you have “extra” electricity from your solar electric system that you aren’t immediately using in your home through self-generation, you’ll export that energy to your utility. But due to utility pushback on customer-owned solar electric systems, you won’t be compensated for that energy at retail rates, even though it will be going directly to your neighbors, and TEP will be charging your neighbors retail rates for that electricity. Instead, you’ll be credited at an “export rate” that’s significantly lower than retail rates. For example, TEP’s current export rate is 7.03¢ per kWh, or about 45% of retail rate. Other utilities in southern Arizona have even lower export rates. Trico’s current export rate is 4.093¢/kwh, SSVEC’s is 4.202¢/kWh, and Unisource has an export rate of 8.39¢/kWh.
But what will your bill be? The export rate system means that with solar on your home, you save money and reduce your bill in two ways. Self-generation brings the greatest savings–you’re avoiding buying expensive electricity at retail rates from TEP, where you pay for the electricity plus taxes and fees. Exported energy does provide you a financial benefit, but it’s much less, because you’re only compensated at the much lower export rate.
At the end of your billing cycle, TEP will charge you for all the electricity you imported from them, including 8-11% taxes, and some additional fees, and a monthly basic service fee of $10-12. Then they will provide you with a bill credit based on the energy you’ve exported.
Let’s look at a day for a solar customer with a 1,100 square foot home, a heat pump, and an electric car:

The graph shows energy consumption (orange), solar production (blue), and energy imported (gray above the line) and exported (gray below the line). You can see that the electric car is charging overnight, and the solar produced a lot of electricity during the day. For this day, the customer imported 15.4 kWh electricity, costing them about $2.51 with taxes. They self-generated 8.1 kWh of energy, saving about $1.32 on their bill. And last, they exported 27.4 kWh, which reduced their bill by $1.92. Even though the amount of energy they exported is about three times more than the amount of self-generated energy, the bill savings from exported energy is only 145% of that from self-generated energy. We see that maximizing self-generation is the goal for maximum savings from solar.
How does this look on a monthly basis? In a recent month, a similar homeowner’s solar electric system produced 608 kWh. They consumed 552 kWh in energy, importing 397 kWh from the grid, and self-generating 211 kWh. They exported 448 kWh to the grid. Even though their solar produced more energy than they used, they still had a power bill:
$12.23 in basic service charges and meter fees
$45.66 in per-kWh energy charges
$18.64 in surcharges and taxes
-$31.50 in credit from exported energy
$45.03 total bill amount
Solar is certainly saving these homeowners significantly, but it’s complex–savings changes as a home shifts between self-generation, grid use, and energy export at each moment. So, it’s important that solar installers and consumers understand how export rates work, and that solar installers carefully model expected solar savings and bill amounts. More on this in the next section!
Different System Sizes, Different Savings & Bills
Each home has a different energy use pattern of how many kilowatt-hours they use each hour of the year. This can change based on the size of the home, if anyone is at home during the day, the age of the heating, ventilation, & air conditioning systems, how a homeowner sets their thermostat, how well the home was constructed and insulated, the age of appliances, and many other factors.
This is why we ask all our potential clients for annual hourly energy use data (often called 8760 data, because there are 8760 hours in a year) to be able to provide you an accurate estimate of the savings from solar and your estimated electric bills after solar.
We need to figure out for each hour of the year how much energy you’re importing, exporting, and self-generating with your solar electric system to be able to propose a system that meets your energy needs and goals.
On our proposal, you’ll see a lot of information. Let’s look at a sample home using the average amount of electricity used by a TEP residential customer, and some of the information we show on our proposal. First, you’ll see a graph that depicts the energy used each month, plus the solar production:

On this graph, the blue bars represent the energy used each month, and the orange represents the solar production. For most months of the year, the solar produces more electricity than is used in the home.
Next, check out this image, which shows that solar is producing 102% of the electricity used in the home each year, and that self-generated electricity represents 42% of the energy the solar electric system makes:

And now, let’s look at the estimated monthly bills, which drop annual electricity costs from $1,621 to $517:

When we look at the total bill column on the right, we see that for most months, this homeowner would pay a small bill of $15-30. But for the summer months with higher energy use from air conditioning, they would have bills in the $60-90 range. For the system above, it would take the customer an estimated 7 years to recoup their investment in solar, also called a “simple payback.” That’s a great deal–especially for a system with major components that are warranted for 25 years and are expected to last even longer!
But what will happen if we adjust the system size to produce less or more energy? Increasing energy production will decrease the percentage of energy that’s self-generated, and increase the percentage of energy exported, making the investment less favorable. Let’s look at what happens to simple payback times as the system size is decreased or increased, for the same energy consumption from above:

We can see that as the system size increases relative to the energy consumption as we move to the right, the percentage of self-generation (red line) decreases. This means that the percentage of exported energy increases, and results in a system that provides a less favorable financial return for the homeowner, increasing the time to recoup their investment (blue bars). Smaller systems that produce around 80-100% of energy use could have a simple payback period as low as seven years, while larger systems that produce 160-190% of usage could take 10+ years to reach simple payback.
Let’s bring it all together, in a table showing some analysis what different system sizes do for this average customer:

We’ve already discussed the relationship between system size and simple payback. But also consider the annual savings versus the net cost after tax credits, which show that there are diminishing returns when a system is oversized.
For example, if this homeowner wanted to install a system to “take their electric bills to zero,” we could propose an 8.14 kW system, which would reduce their annual electricity costs from $1,621 to $16. It would produce 160% of their annual usage, but would take an extra three years to recoup their investment, would take their rate of return from 12.5% down to 7.7%, and would cost them almost $6,000 more, even after tax credits! Not a great plan!
Additionally, Arizona utilities technically don’t allow systems to be sized over 125% of annual usage. Practically, because oversized systems provide discounted electricity to utilities, some may ignore this rule.
At Net Zero Solar, we generally like to design and install systems that produce 80-100% of the electricity annually used. As you can see, the 4.44 kW and 5.18 kW systems provide the best rate of return on your investment and keep installation costs lower.
We’re happy to install larger systems to account for future loads, just as long as clients truly know how everything works, and realize it’s not the best choice financially.

Why Do Solar Installers Promise Zero Electric Bills and Oversize Systems?
We see two main reasons that solar sales and solar installation companies do this. Many solar sales companies are disconnected from the realities of residential solar. Their salespeople who are knocking on doors in your neighborhood are mainly compensated on commission, and have little or no experience living with solar. After selling the job, these salespeople take their cut, and pass the installation onto contract installation companies who are focused on volume of installation, not quality or long-term service.
Both sales organizations and contract solar installers have a strong motivation to oversize the system, primarily because it increases their profits, even if it is a poor deal for consumers. These folks tend to knock on doors, bid high prices for oversized systems, embed significant costs in for any loan products, and disappear after the sale is complete.
The other reason is that in the past, it was more practical to reduce your bill closer to zero. Solar customers prior to October 2018 had an option to use what’s called “net metering.” Net metering provided a 1-to-1 credit for energy sent back to TEP, meaning you’d be billed each month for only the net energy you used. For some homeowners on net metering who have a solar electric system that produces as much energy as they use annually, they may pay only $15-25 each month in basic service charges, but no more. As discussed above, with net-billing export rates, this doesn’t happen anymore.

Good Reasons to Choose a Larger System
We’ve explained why it’s generally a poor decision to oversize your solar electric system, but there are some cases where it makes sense.
With export rates, the amount your utility will pay you per exported kWh remains fixed for ten years. But if you add to your solar electric system during that ten year period, you’ll be “bumped down” to a lower export rate. So if you plan to add significant electric loads or increase your electricity use in the next few years, it might be better to go big in the beginning.
Some of the common reasons we see electricity use increase in a home are:
• Working at home or retiring
• Adding an electric vehicle
• Building an addition or adding a pool
• Changes in heating or air conditioning costs from changing thermostat settings after installing solar
• Changing from gas cooking to induction cooking
• Changing from gas heat to a heat pump
• More cooling days with hotter summers
It’s also possible to have energy use drop over time, if a homeowner does energy saving upgrades such as better insulation, newer heating and cooling equipment, newer appliances, or a heat pump water heater.
So how do we determine how much more energy you might use in the future? It will be an estimate in any case, but here are some thoughts and resources to consider about increases in energy use:
Working at home or retiring: This is hard to estimate, as each person or family’s energy use patterns are different. If your electric utility provides you with access to your daily energy use data online, you can look at your weekend or holiday usage across various times of the year, and determine how much more energy you use when you’re home. Being at home during the day often gives you more opportunities to use your solar energy as it’s generated, increasing your savings.
Adding an electric vehicle: Many electric vehicles will specify how many miles they will go per kWh of energy. For example, a small electric vehicle like a Nissan Leaf or a Tesla Model 3 will typically travel 3-4 miles per kWh. If you plan to drive 12,000 miles per year, you can divide 12,000 by 3, and estimate that this EV will use around 4,000 kWh of electricity each year, or about 333 kWh each month. For more detailed calculations which take into account a specific electric vehicle, your mix of city/highway driving and other factors, see this calculator from the Department of Energy.
Building an addition or adding a pool: For an addition, ask your architect if they are able to model expected electrical use. For a pool, find out from your pool contractor what pool filter pump they plan to use, how many watts it uses, and how many hours it will run. You can use this calculator to find daily kWh, and then calculate monthly or annual energy use.. If you plan to heat your pool with electricity or even with a heat pump water heater, this will use an enormous amount of energy. Ask your pool contractor to provide you with monthly estimates of energy usage for any pool heater.
Changing to induction cooking: Induction cooktops or stoves are more efficient than either gas or standard electric stoves by 15-20%. If you currently have an electric stove, switching to induction will reduce the amount of electricity you use. If you currently cook with fossil gas, check with your induction stove or cooktop manufacturer for an estimated kWh per month or year that your new stove will use.
Changing from gas heat to a heat pump: Your HVAC contractor should be able to provide you an estimated annual electricity use based on your local climate conditions. You may also find this heat pump calculator helpful in determining estimated energy use. One thing to consider is that with a new heat pump, your air conditioning is also likely to be more efficient if your current unit isn’t new.
Your Feedback and Questions
Thanks for reading this far! We’d love to hear your thoughts and questions in the comments section below. If you’re interested in installing solar for your home, please explore our website.


Recent Comments